Home » About Immigrants » Quick Statistics » Greater Boston

Quick Immigration Statistics: Boston

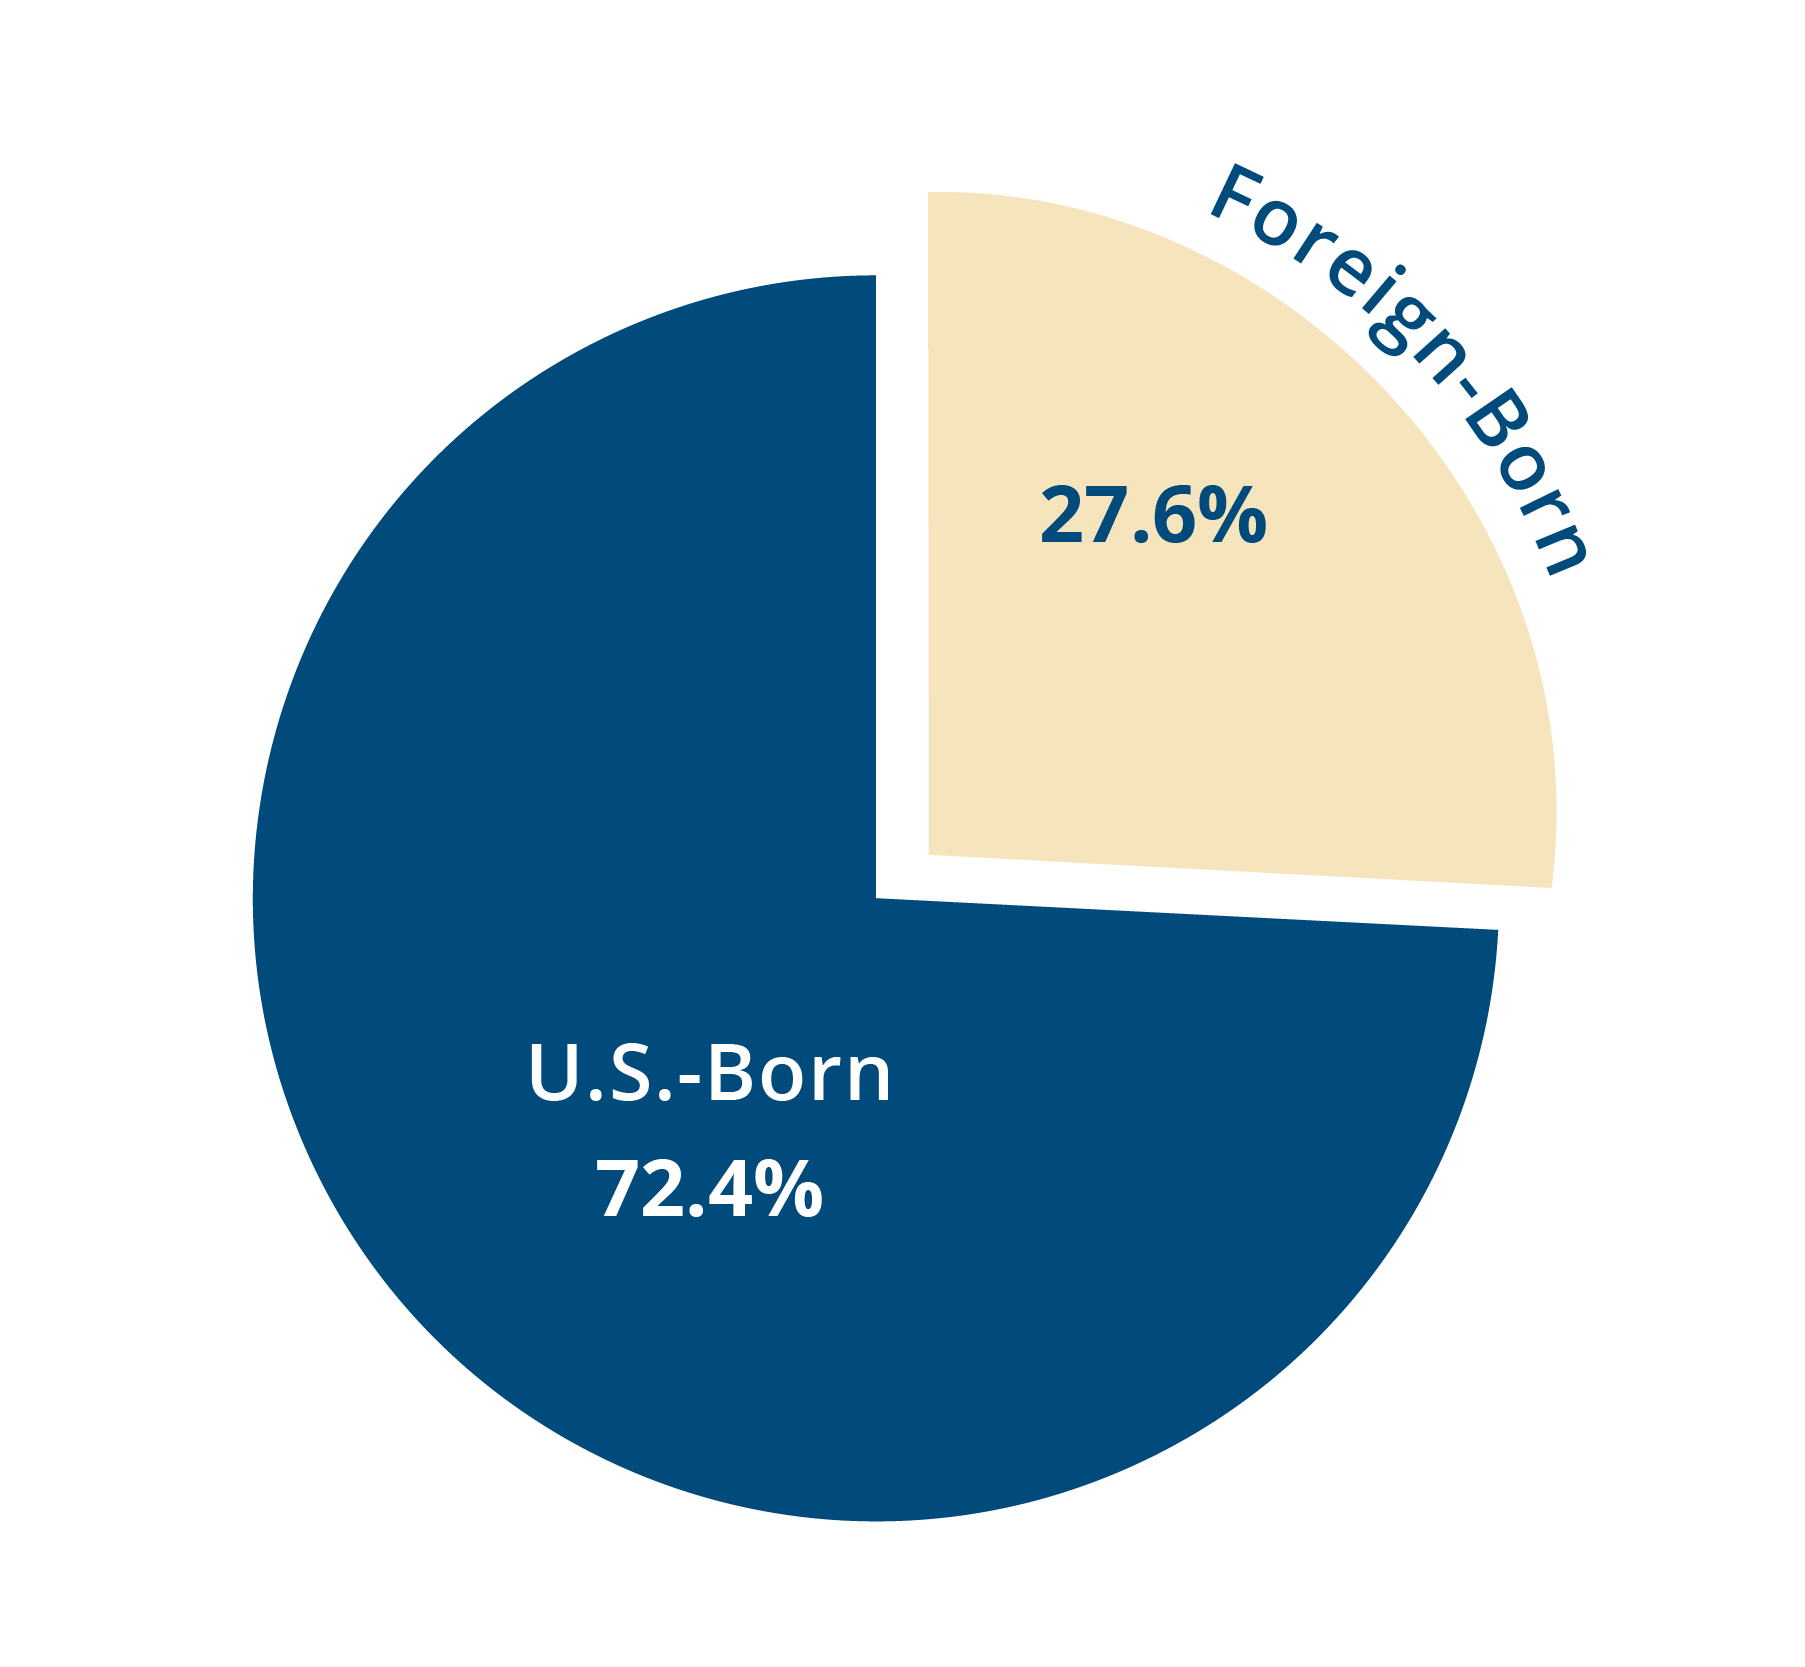
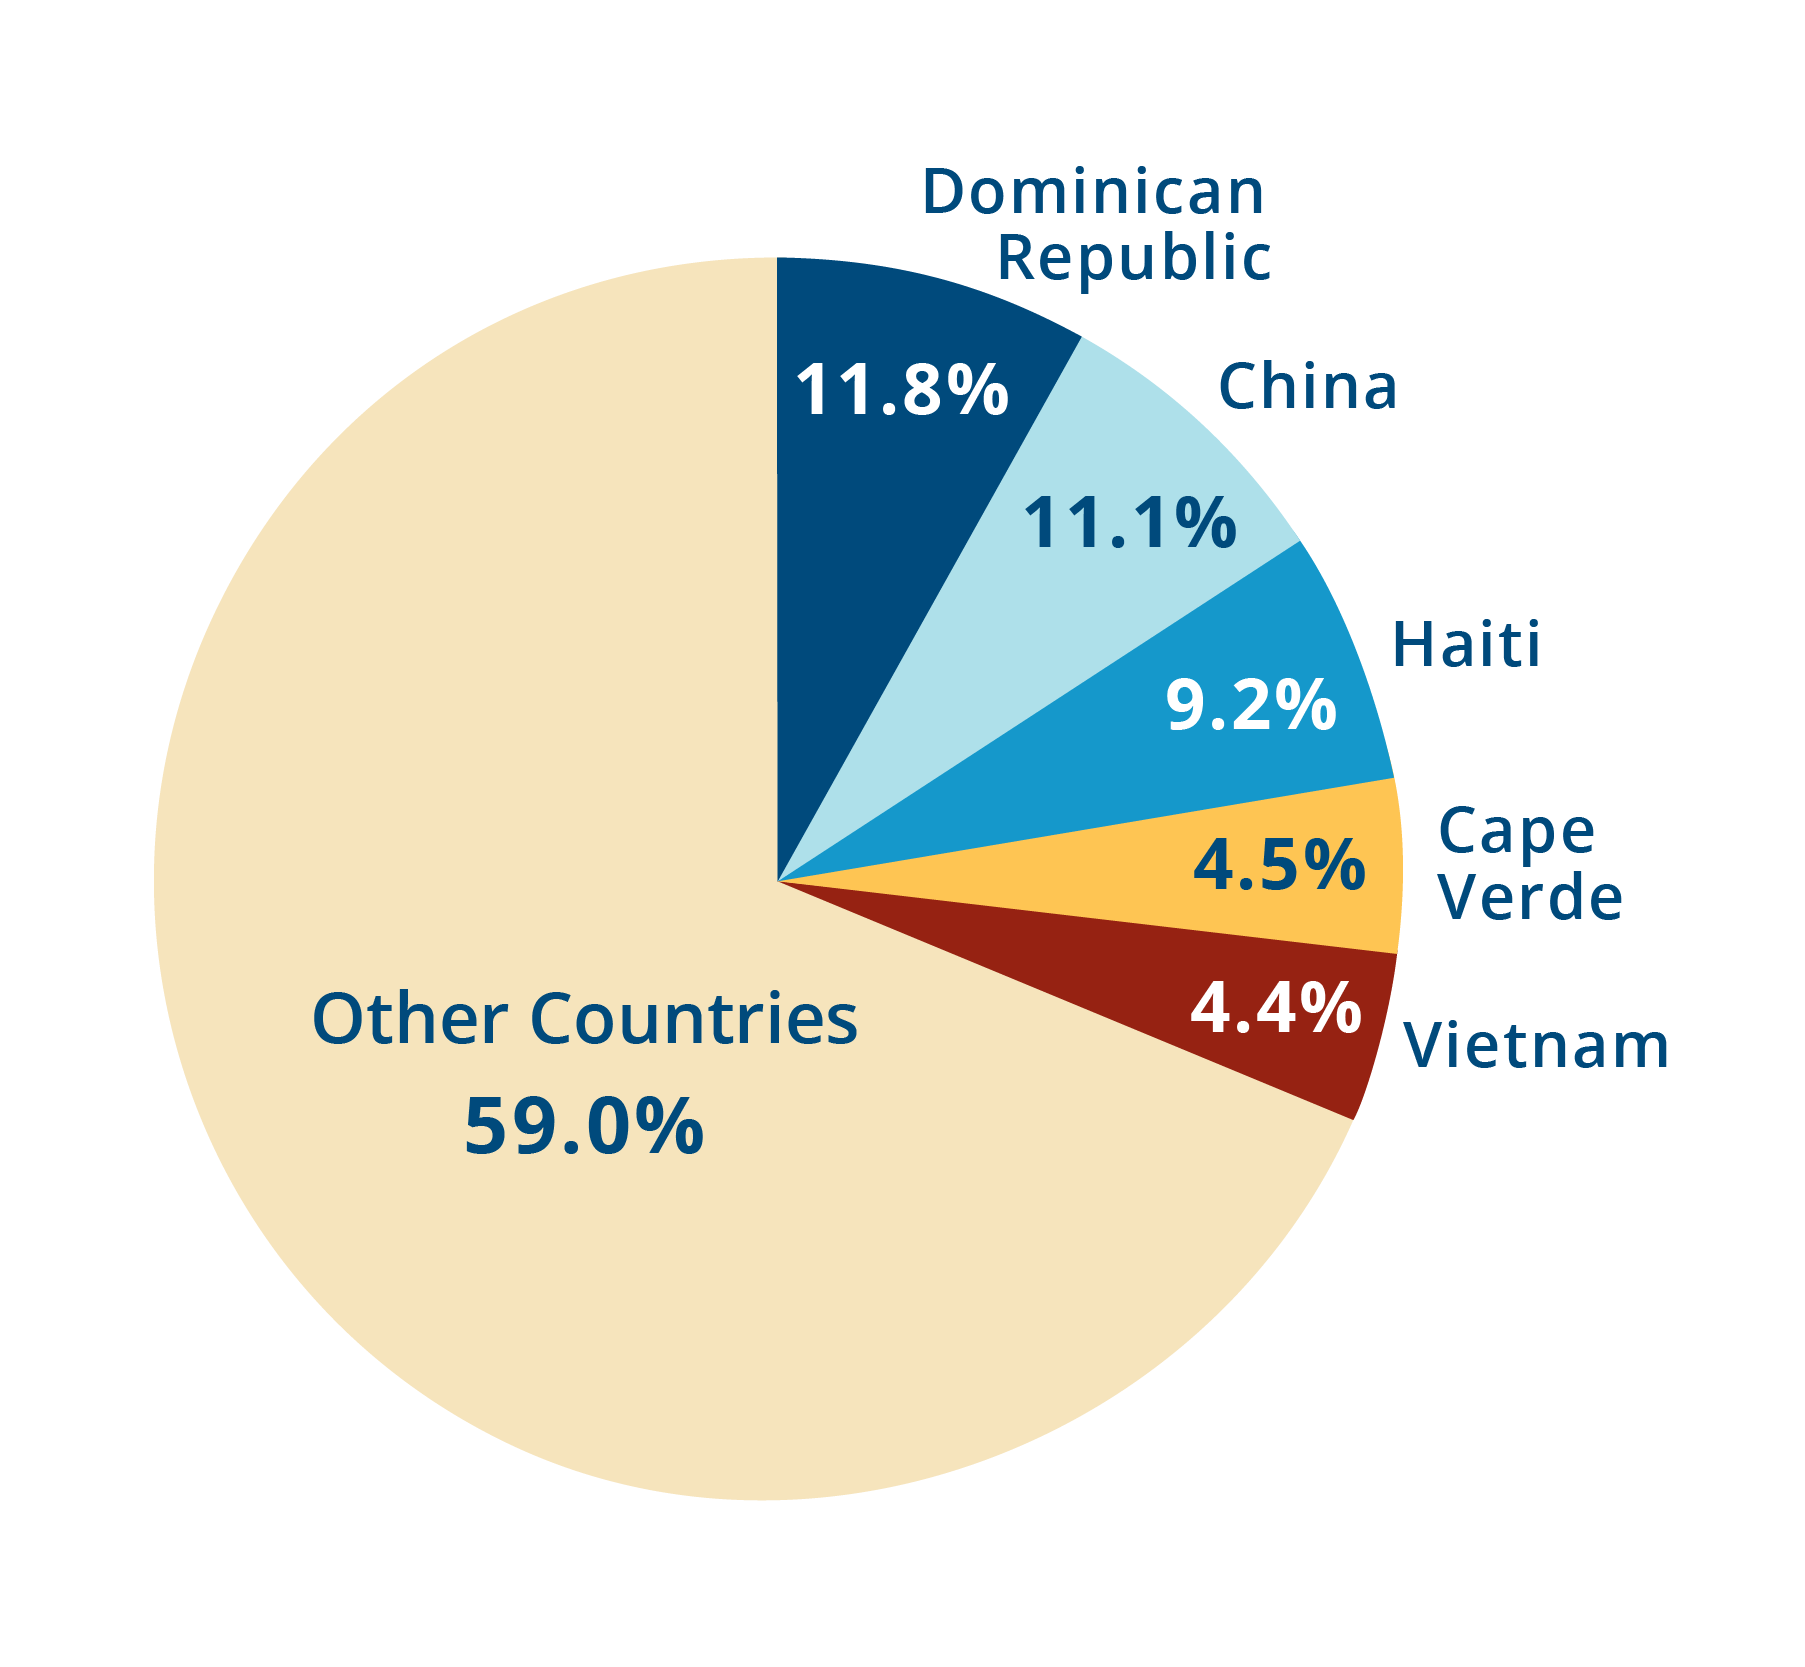
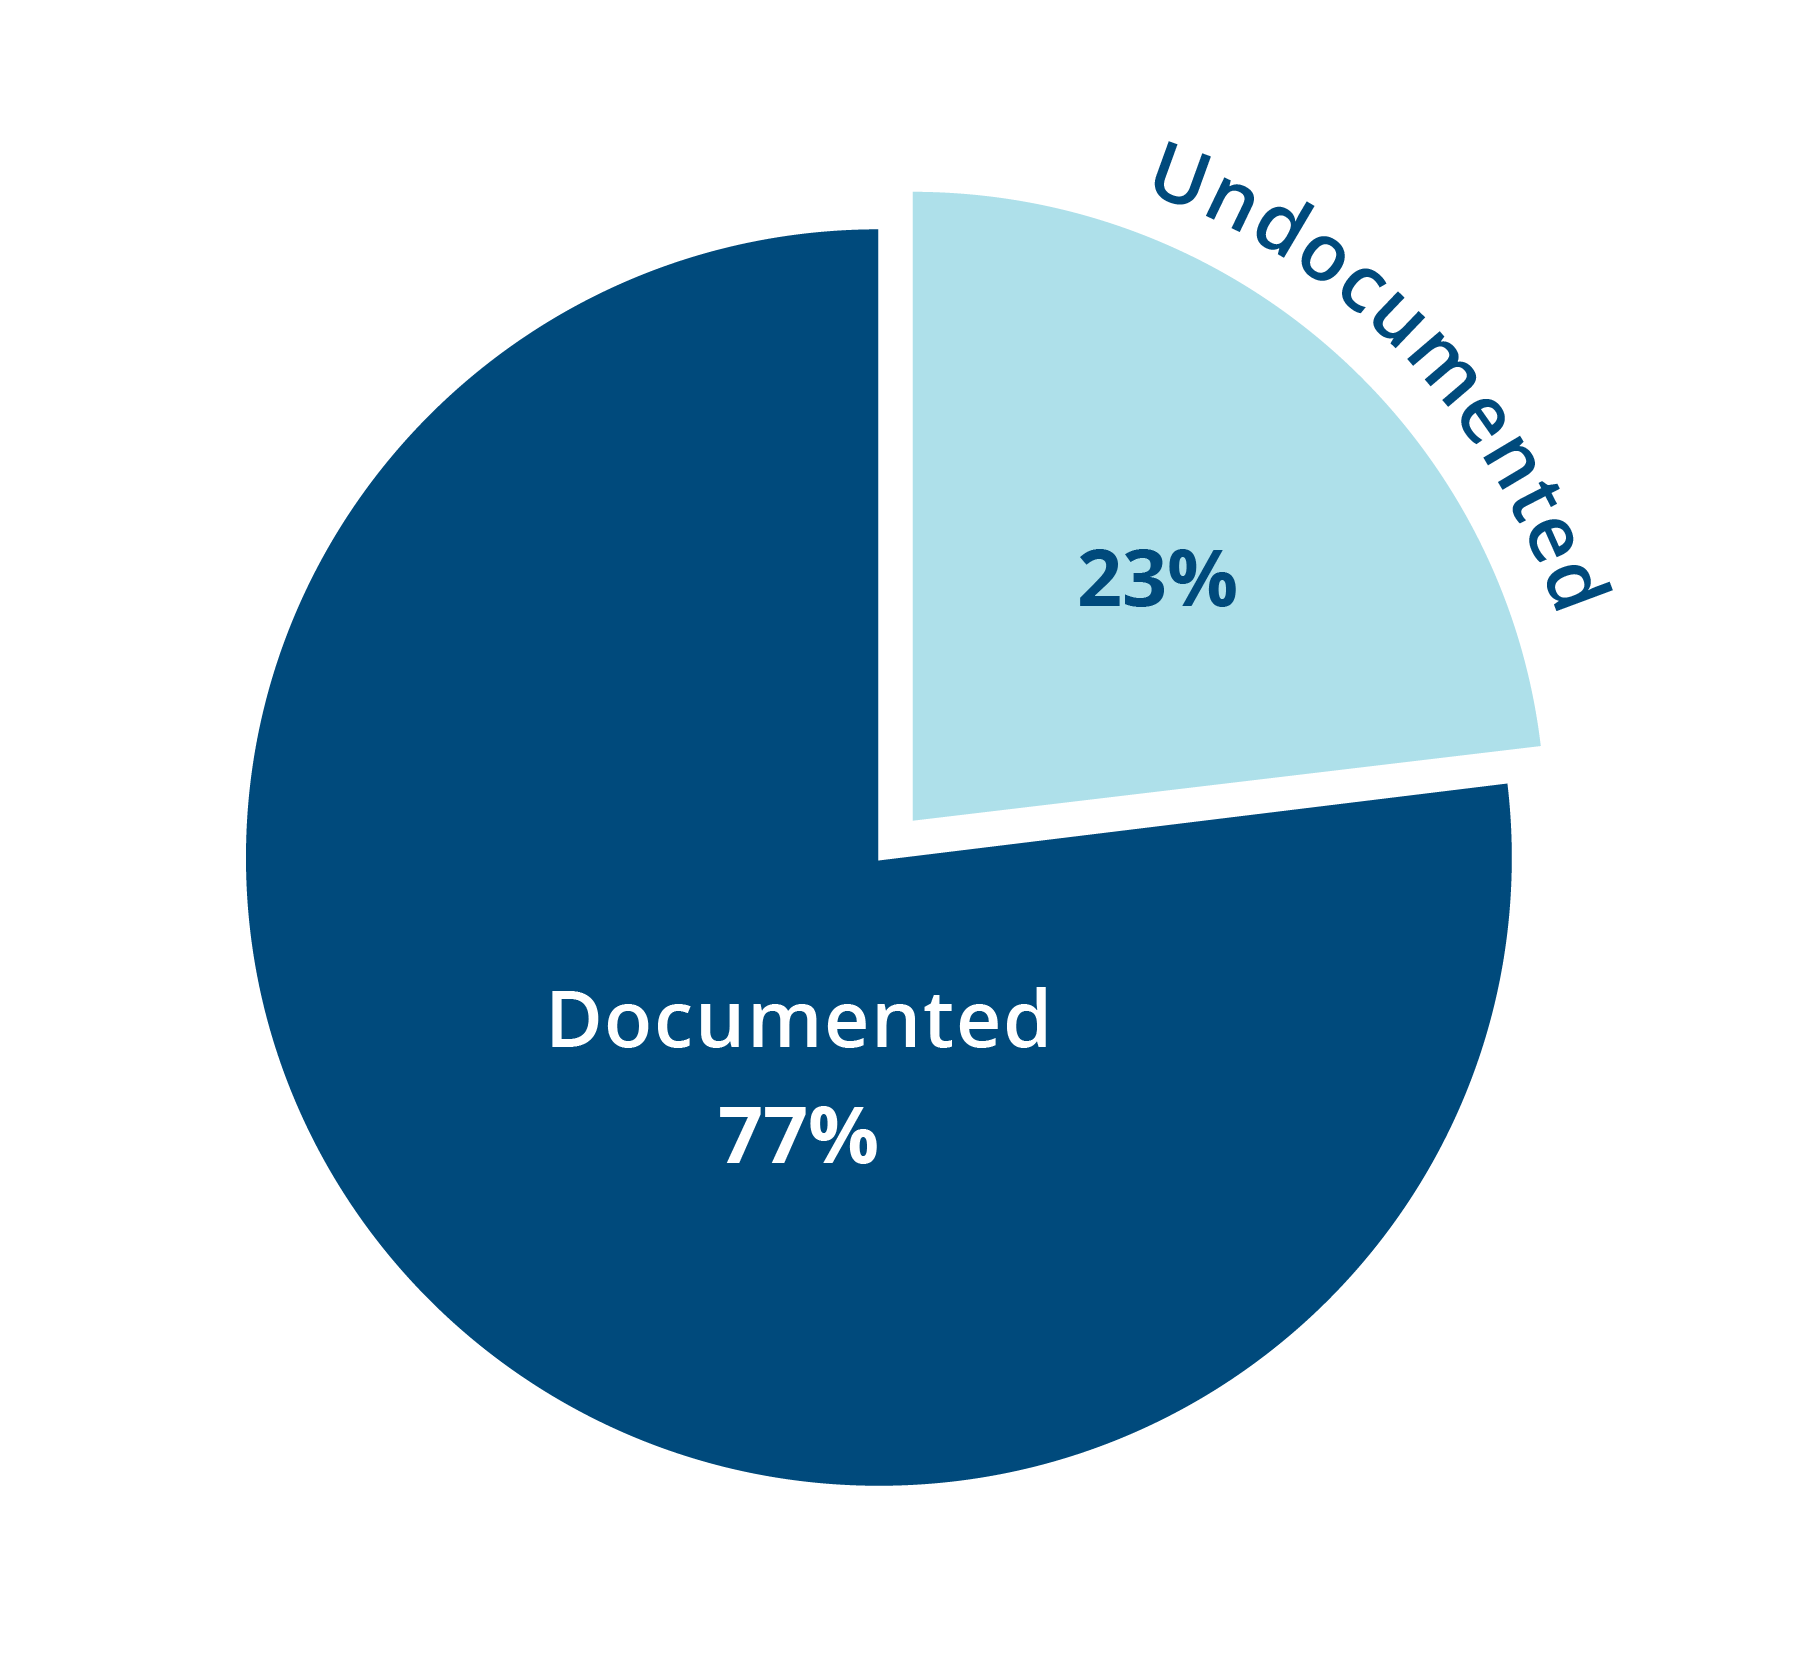
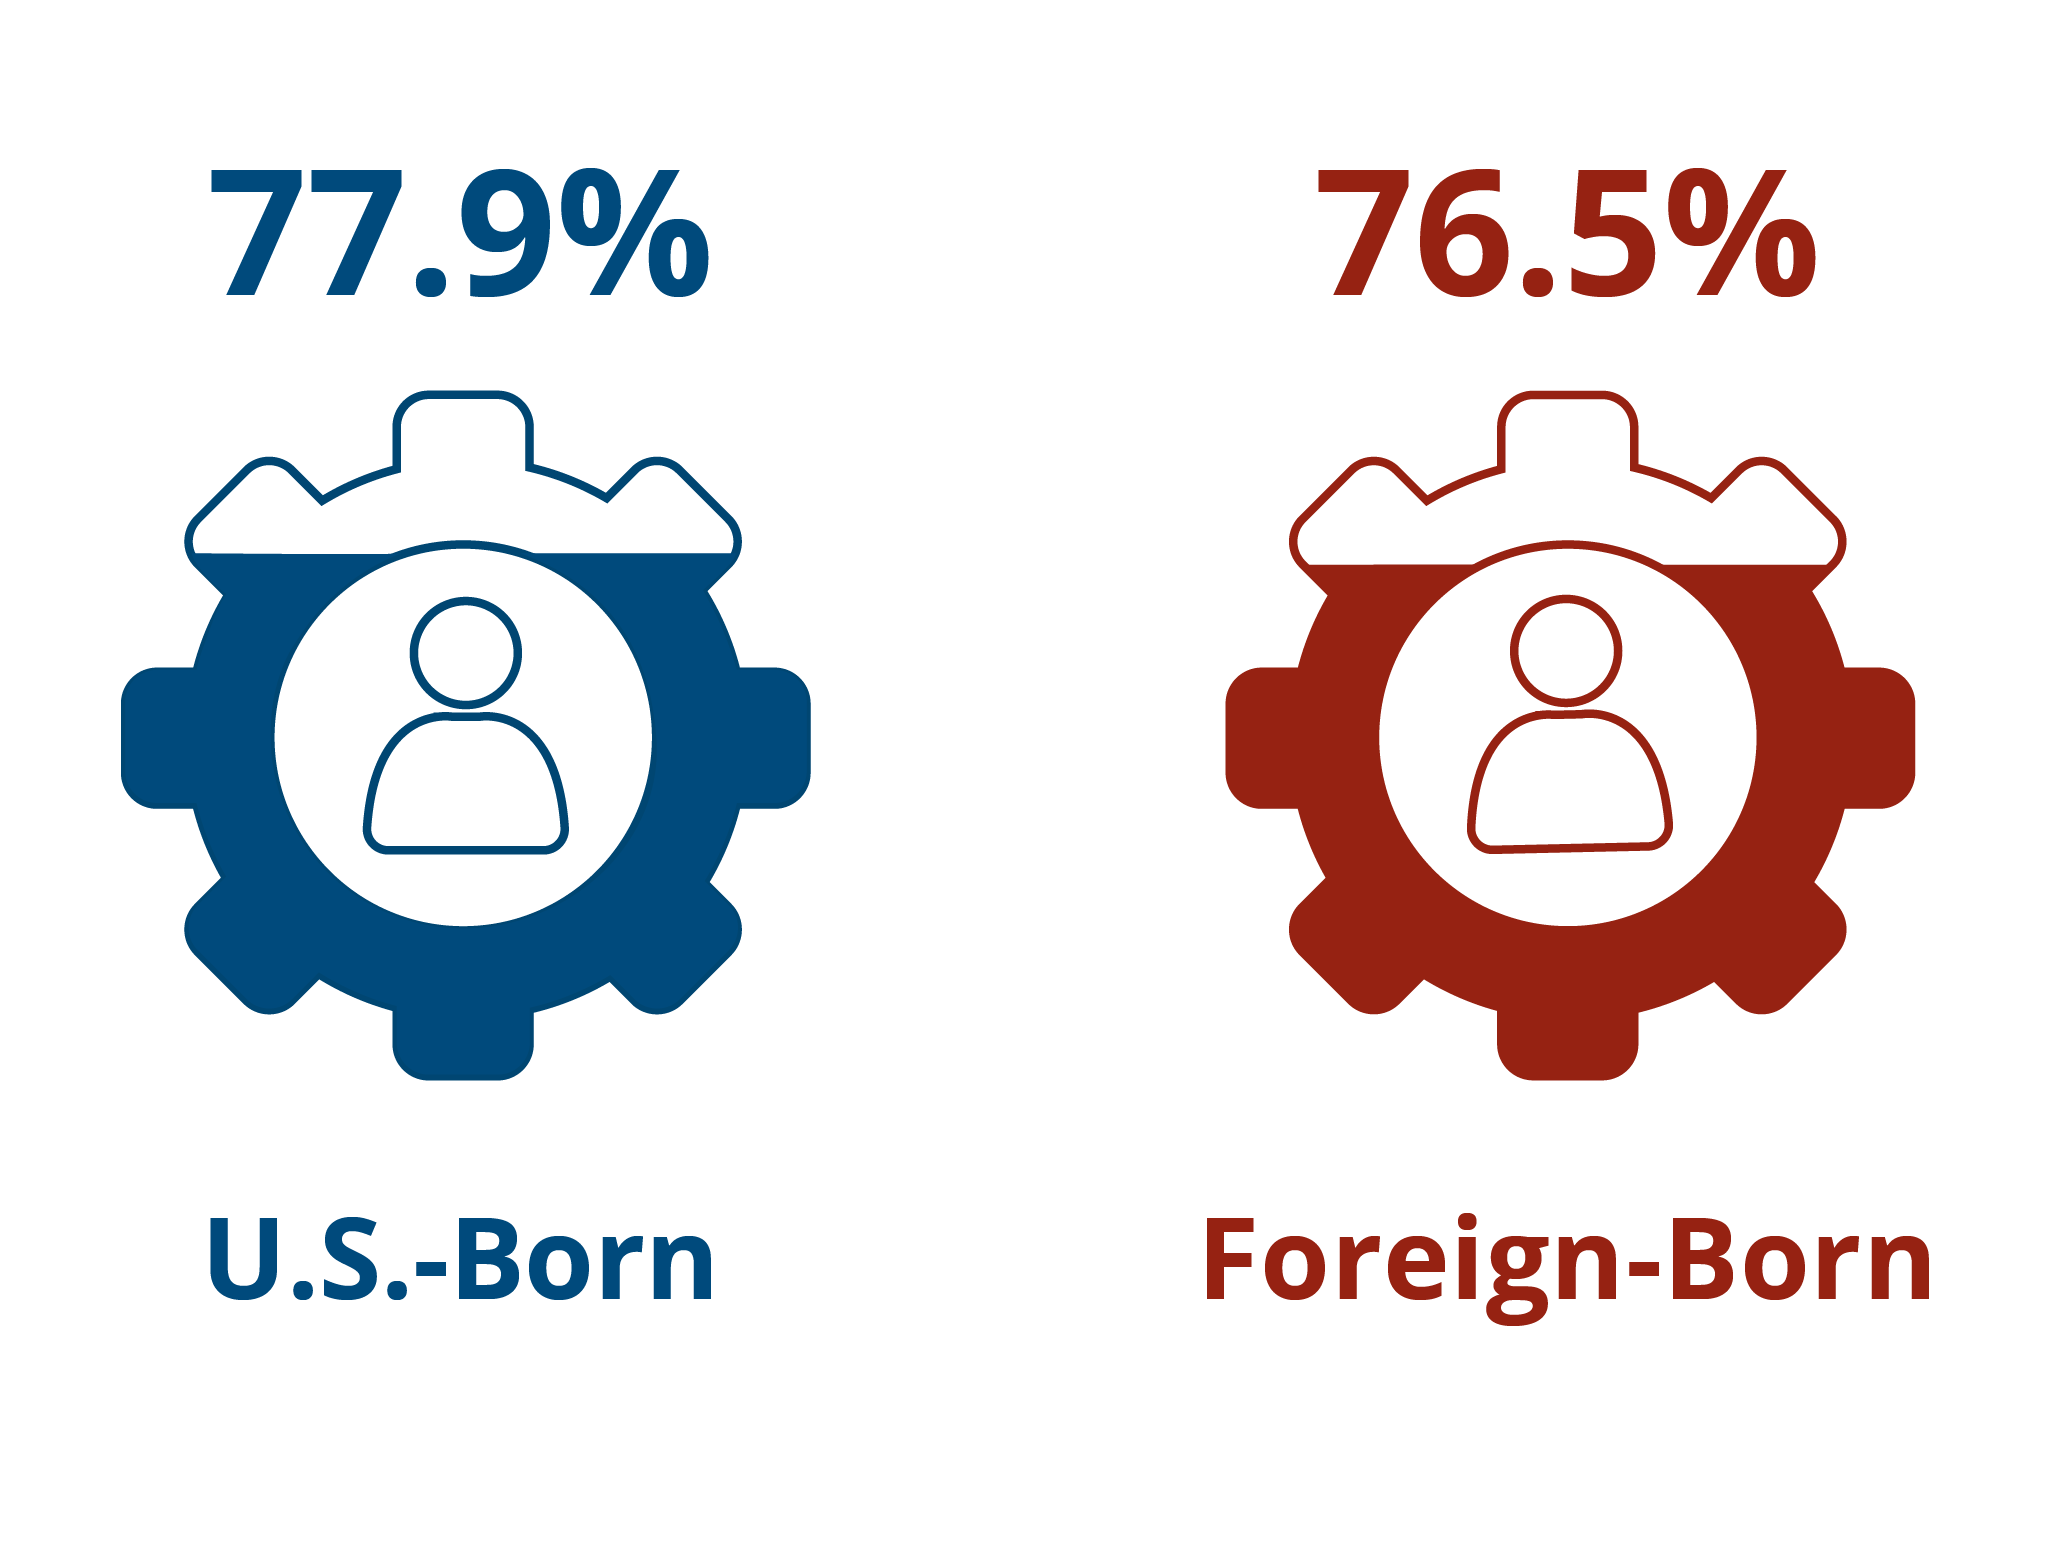
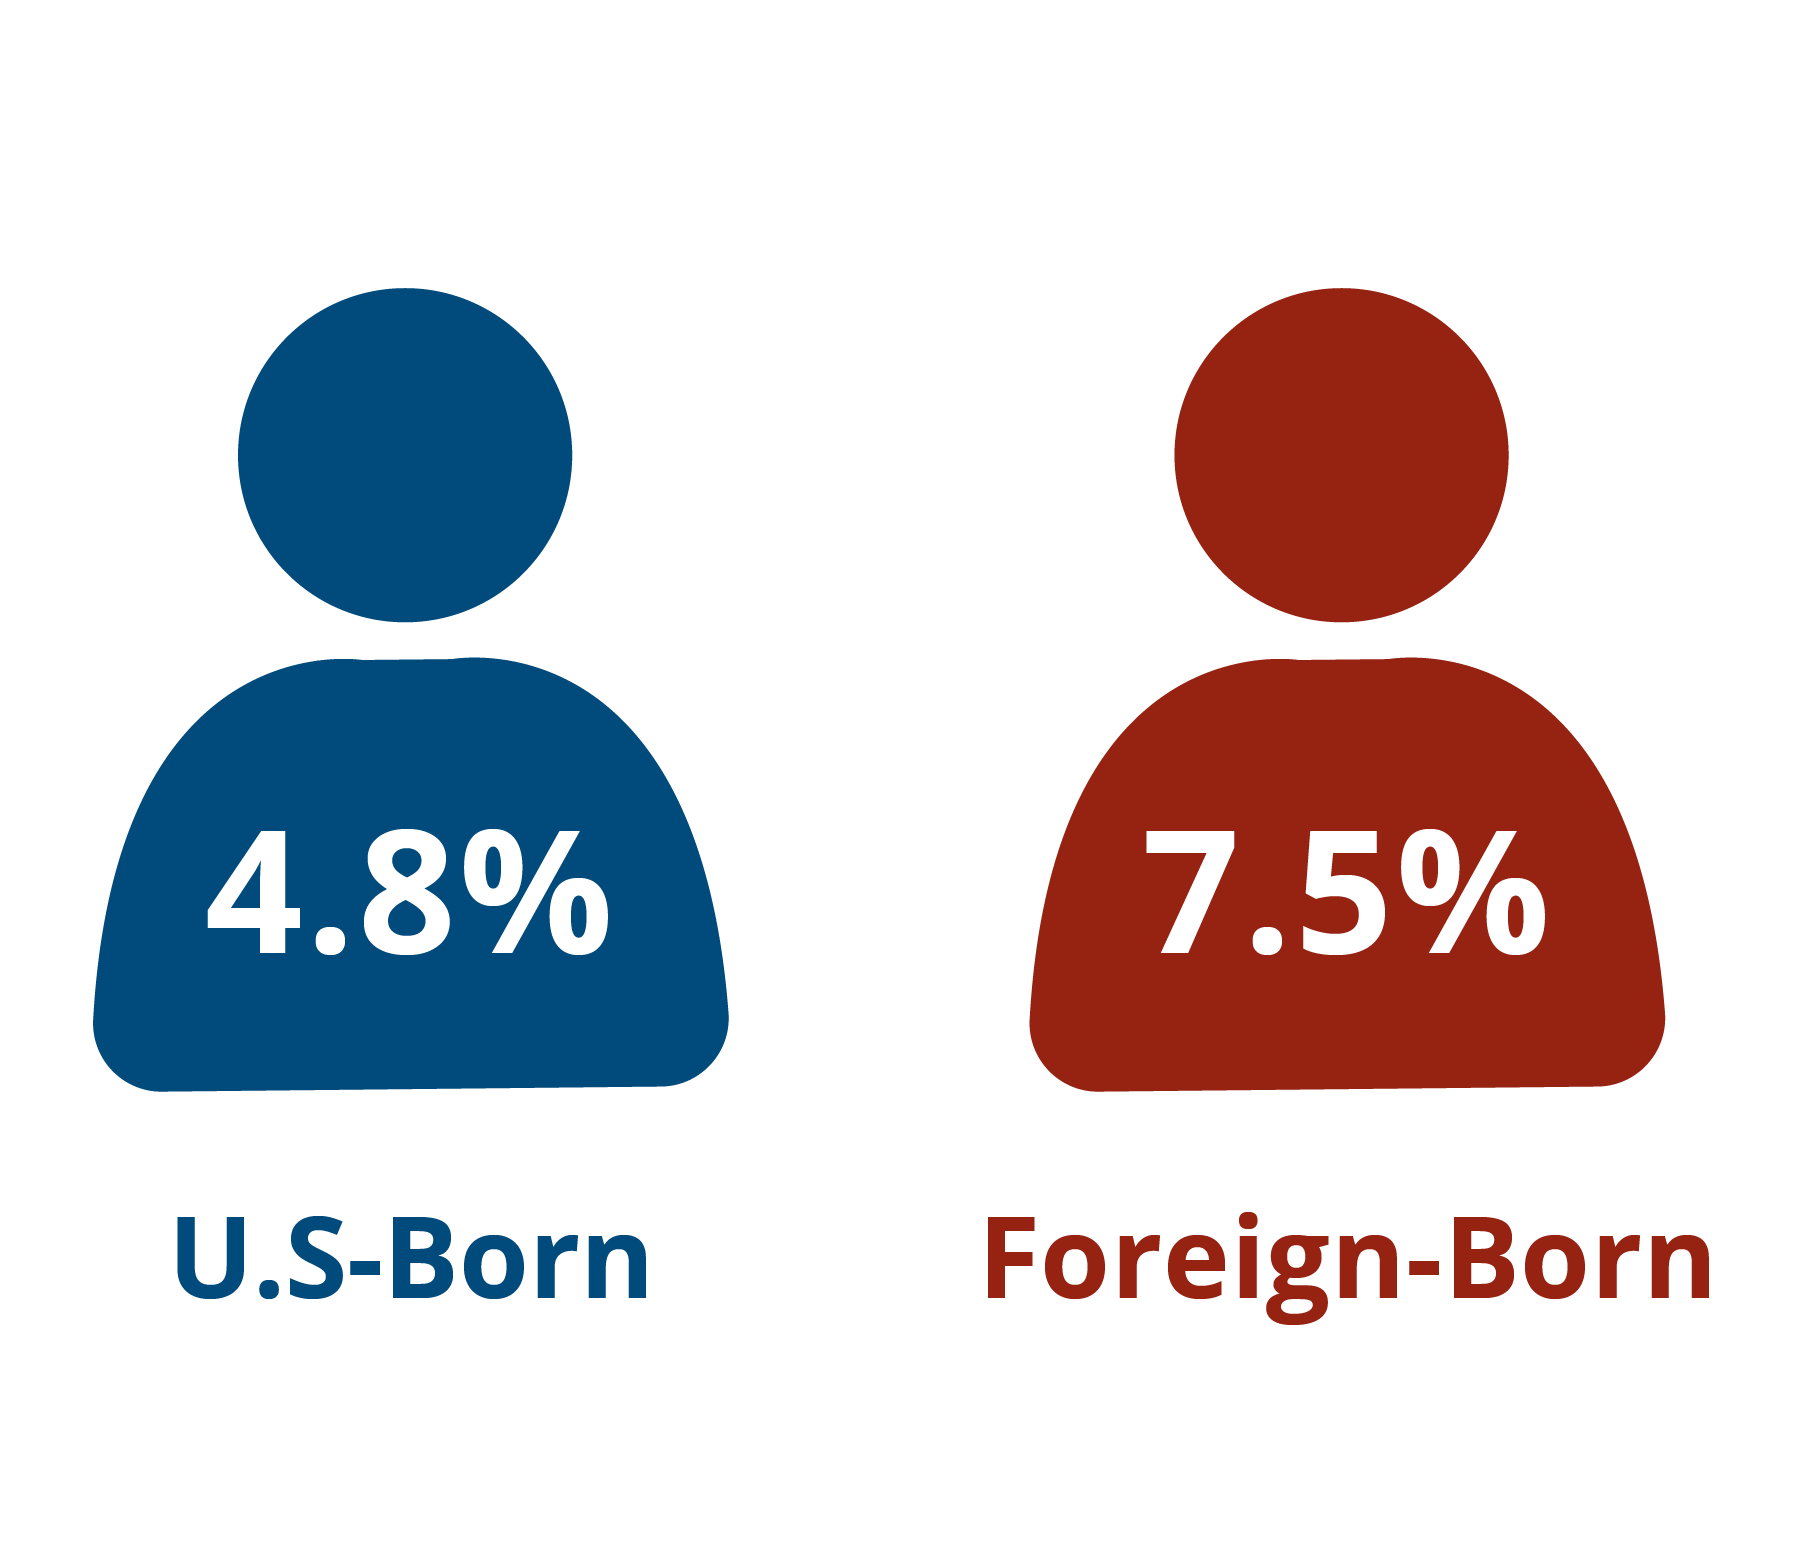
The Immigrant Learning Center has compiled a list of quick immigration statistics and facts to answer your most pressing questions about the current immigration landscape in Boston.

Our Quick Massachusetts Stats page has facts on immigrants living in the full Commonwealth of Massachusetts, and our Quick U.S. Immigration Statistics page will give you the basics on immigration in the United States. If you’re looking for more detailed data on Boston immigrant populations, you can request a free, personalized fact sheet through the Immigration Data on Demand service from the Institute for Immigration Research. If you have questions or suggestions about these Boston Quick Immigration Stats, feel free to contact us at public.education@ilctr.org.

There are approximately 184,000 immigrants in Boston.

How many immigrants are there in Boston, and who are they?

There are approximately 184,000 immigrants in Boston.

About one in every four (27.6%) Boston residents is foreign-born.

A pie chart that shows 72.4 percent of Boston's population is U.S. born and 27.6 percent are foreign born.

Source: U.S. Census 2022 American Community Survey 5-year Estimates

The five largest immigrant populations in Boston are from:

A pie chart of Boston's population that shows 59 percent of the immigrant population is from other countries. The other countries represented are Dominican Republic, China, Haiti, Cape Verde and Vietnam.

Source: U.S. Census 2022 American Community Survey 5-year Estimates

What is the migration status of most foreign-born people in Boston?

The majority (77%) of immigrants in Boston have authorization.

A pie chart that shows 77 percent of Boston's immigrant population is documented and 23 percent is undocumented.

Source: Pew Research Center estimates based on augmented 2016 U.S. Census Bureau data

More than half (52.7%) of all immigrants in Boston have become United States citizens.

A pie chart of naturalization in Boston. 52.7 percent are citizens and 47.3 percent are non citizens.

Source: U.S. Census 2022 American Community Survey 5-year Estimates

How do immigrants impact the Boston workforce?

Immigrants in Boston have a 76.5 percent rate of workforce participation.*

Illustration of two gears. The one on the left is blue and shows 77.9 percent of the labor force is U.S. born. The one on the right is red and says 76.5 percent are foreign born.

Source: U.S. Census 2022 American Community Survey 5-year Estimates

In Boston, 7.5 percent of immigrants are self-employed.

Illustration of two people. The one on the left is blue and shows 4.8 percent are U.S. born. The one on the right is red and shows 7.5 percent foreign born.

Source: U.S. Census 2022 American Community Survey 5-year Estimates

* The workforce participation rate is calculated by dividing the number of people working and those actively seeking work by the number of non-institutionalized, working-age (16-65) civilians.