The Immigrant Learning Center has compiled key statistics on immigrants in the United States to answer your most pressing questions about the current immigration landscape in the U.S.
Quick Immigration Statistics: United States
If you’re looking for more detailed data or want to examine specific immigrant populations, you can request a free, personalized fact sheet through the Immigration Data on Demand service from our partner, the Institute for Immigration Research at George Mason University
To learn more about the immigrants of our home state of Massachusetts, visit our Quick Immigration Statistics: Massachusetts or Quick Immigration Statistics: Boston pages.
If you have questions or suggestions about our Quick Immigration Stats, feel free to contact us at public.education@ilctr.org.
There are approximately 46 million immigrants in the United States.
How many immigrants are there in the United States, and who are they?
There are approximately 46 million immigrants in the United States.*
About one in every eight U.S. residents (13.7%) is foreign-born.
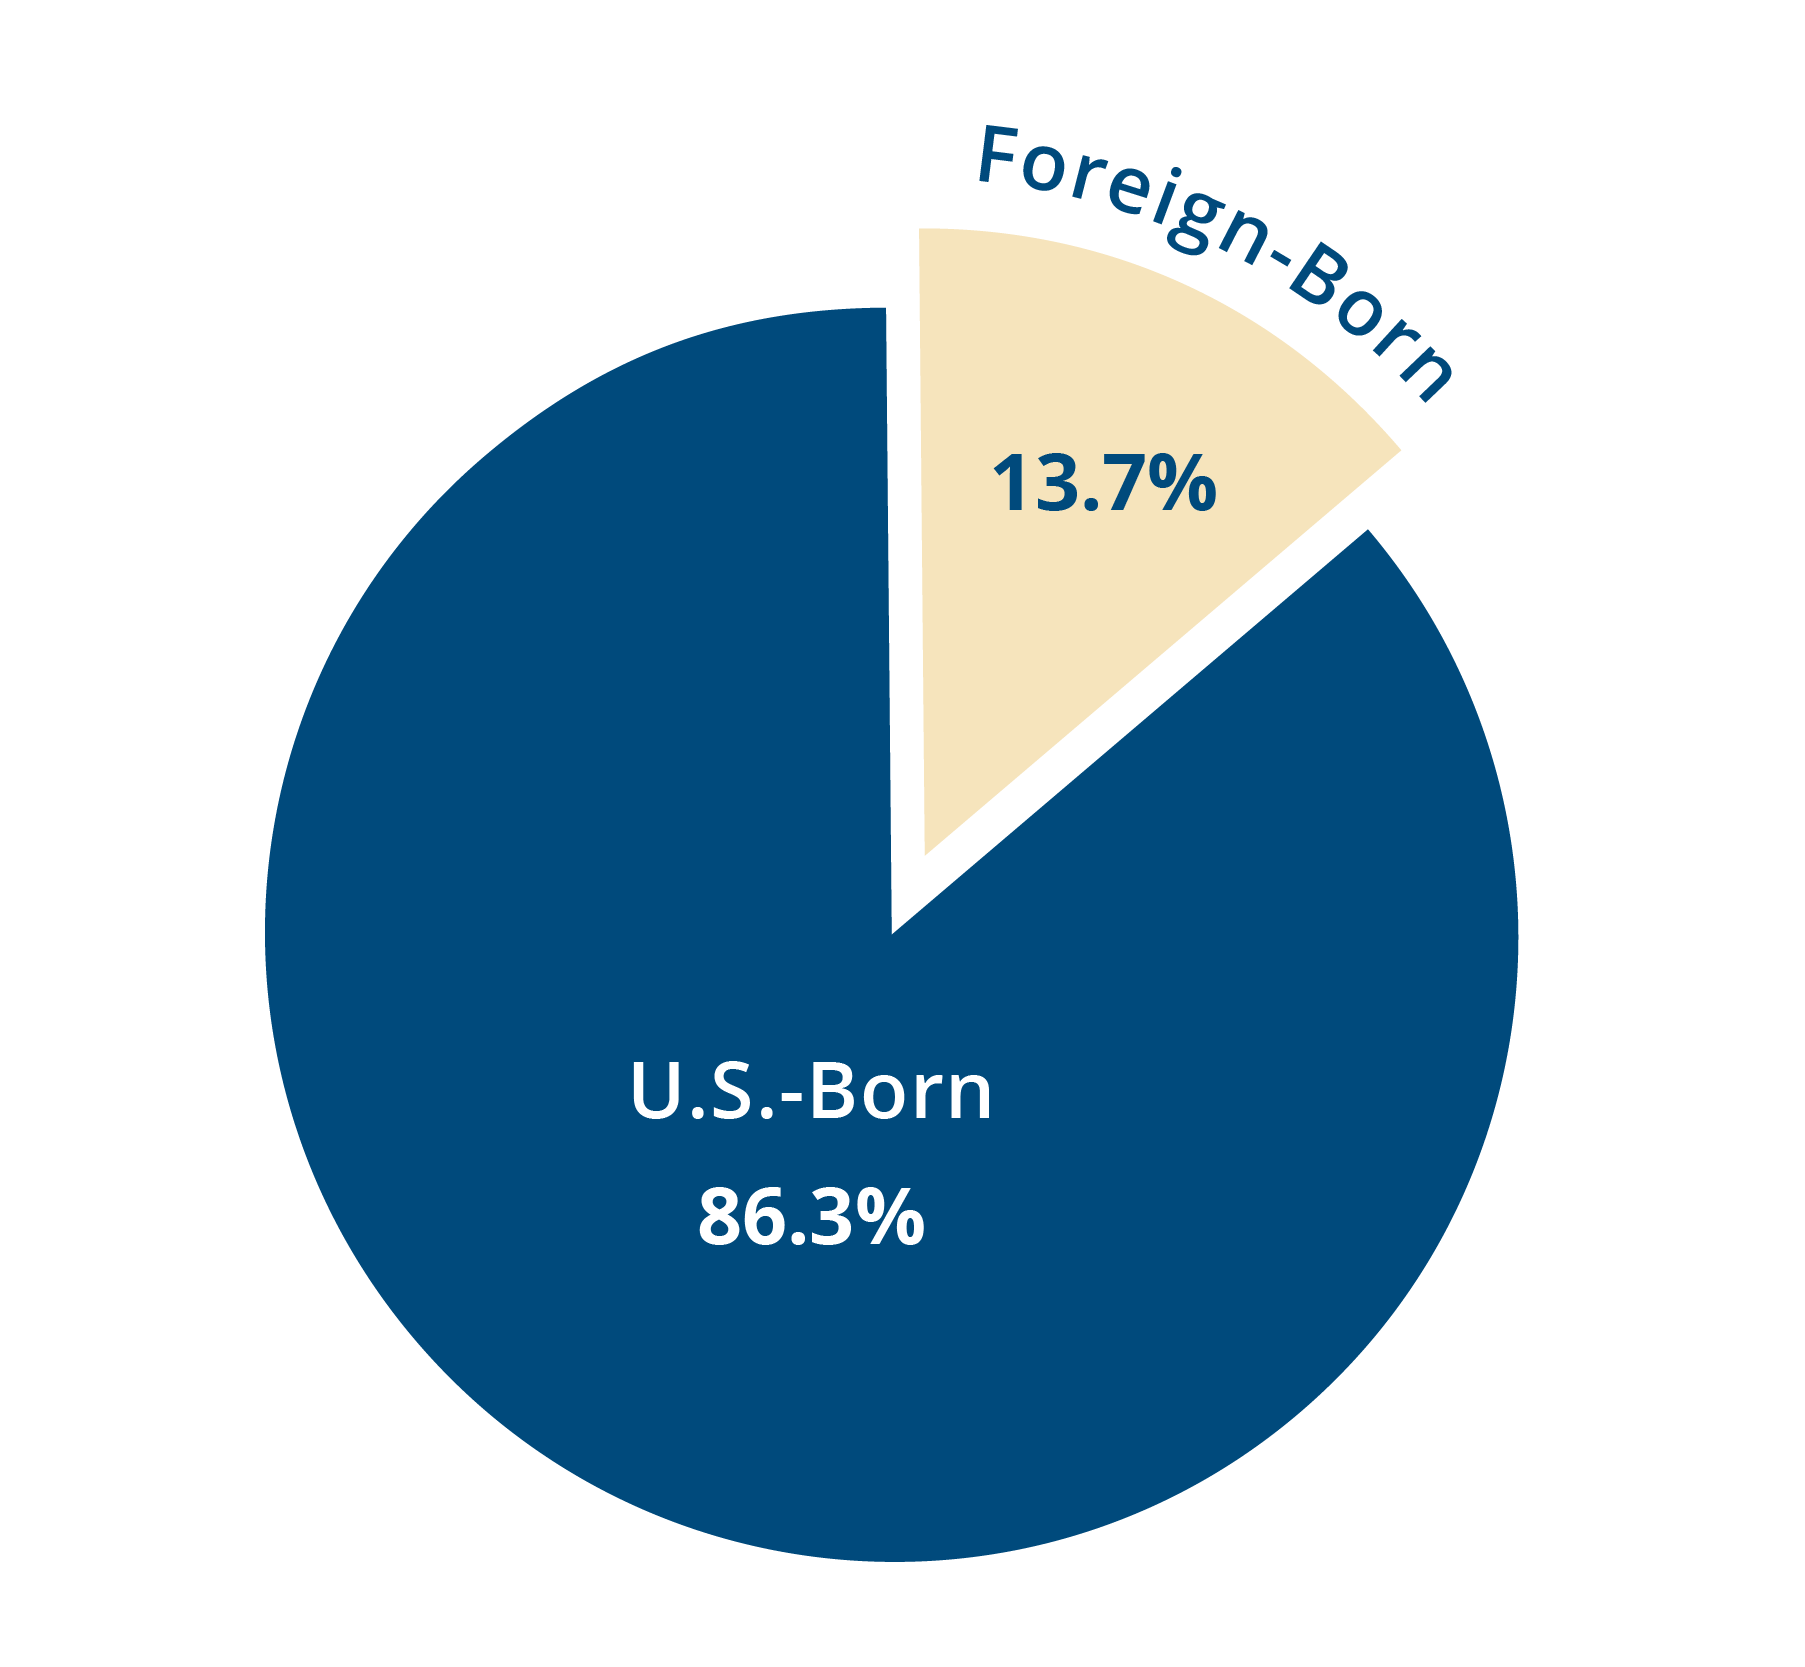
Source for graph: U.S. Census 2022 American Community Survey 5-year Estimates
*Source for total: U.S. Census 2023 American Community Survey 5-year Estimates
The five largest immigrant populations in the United States are from:
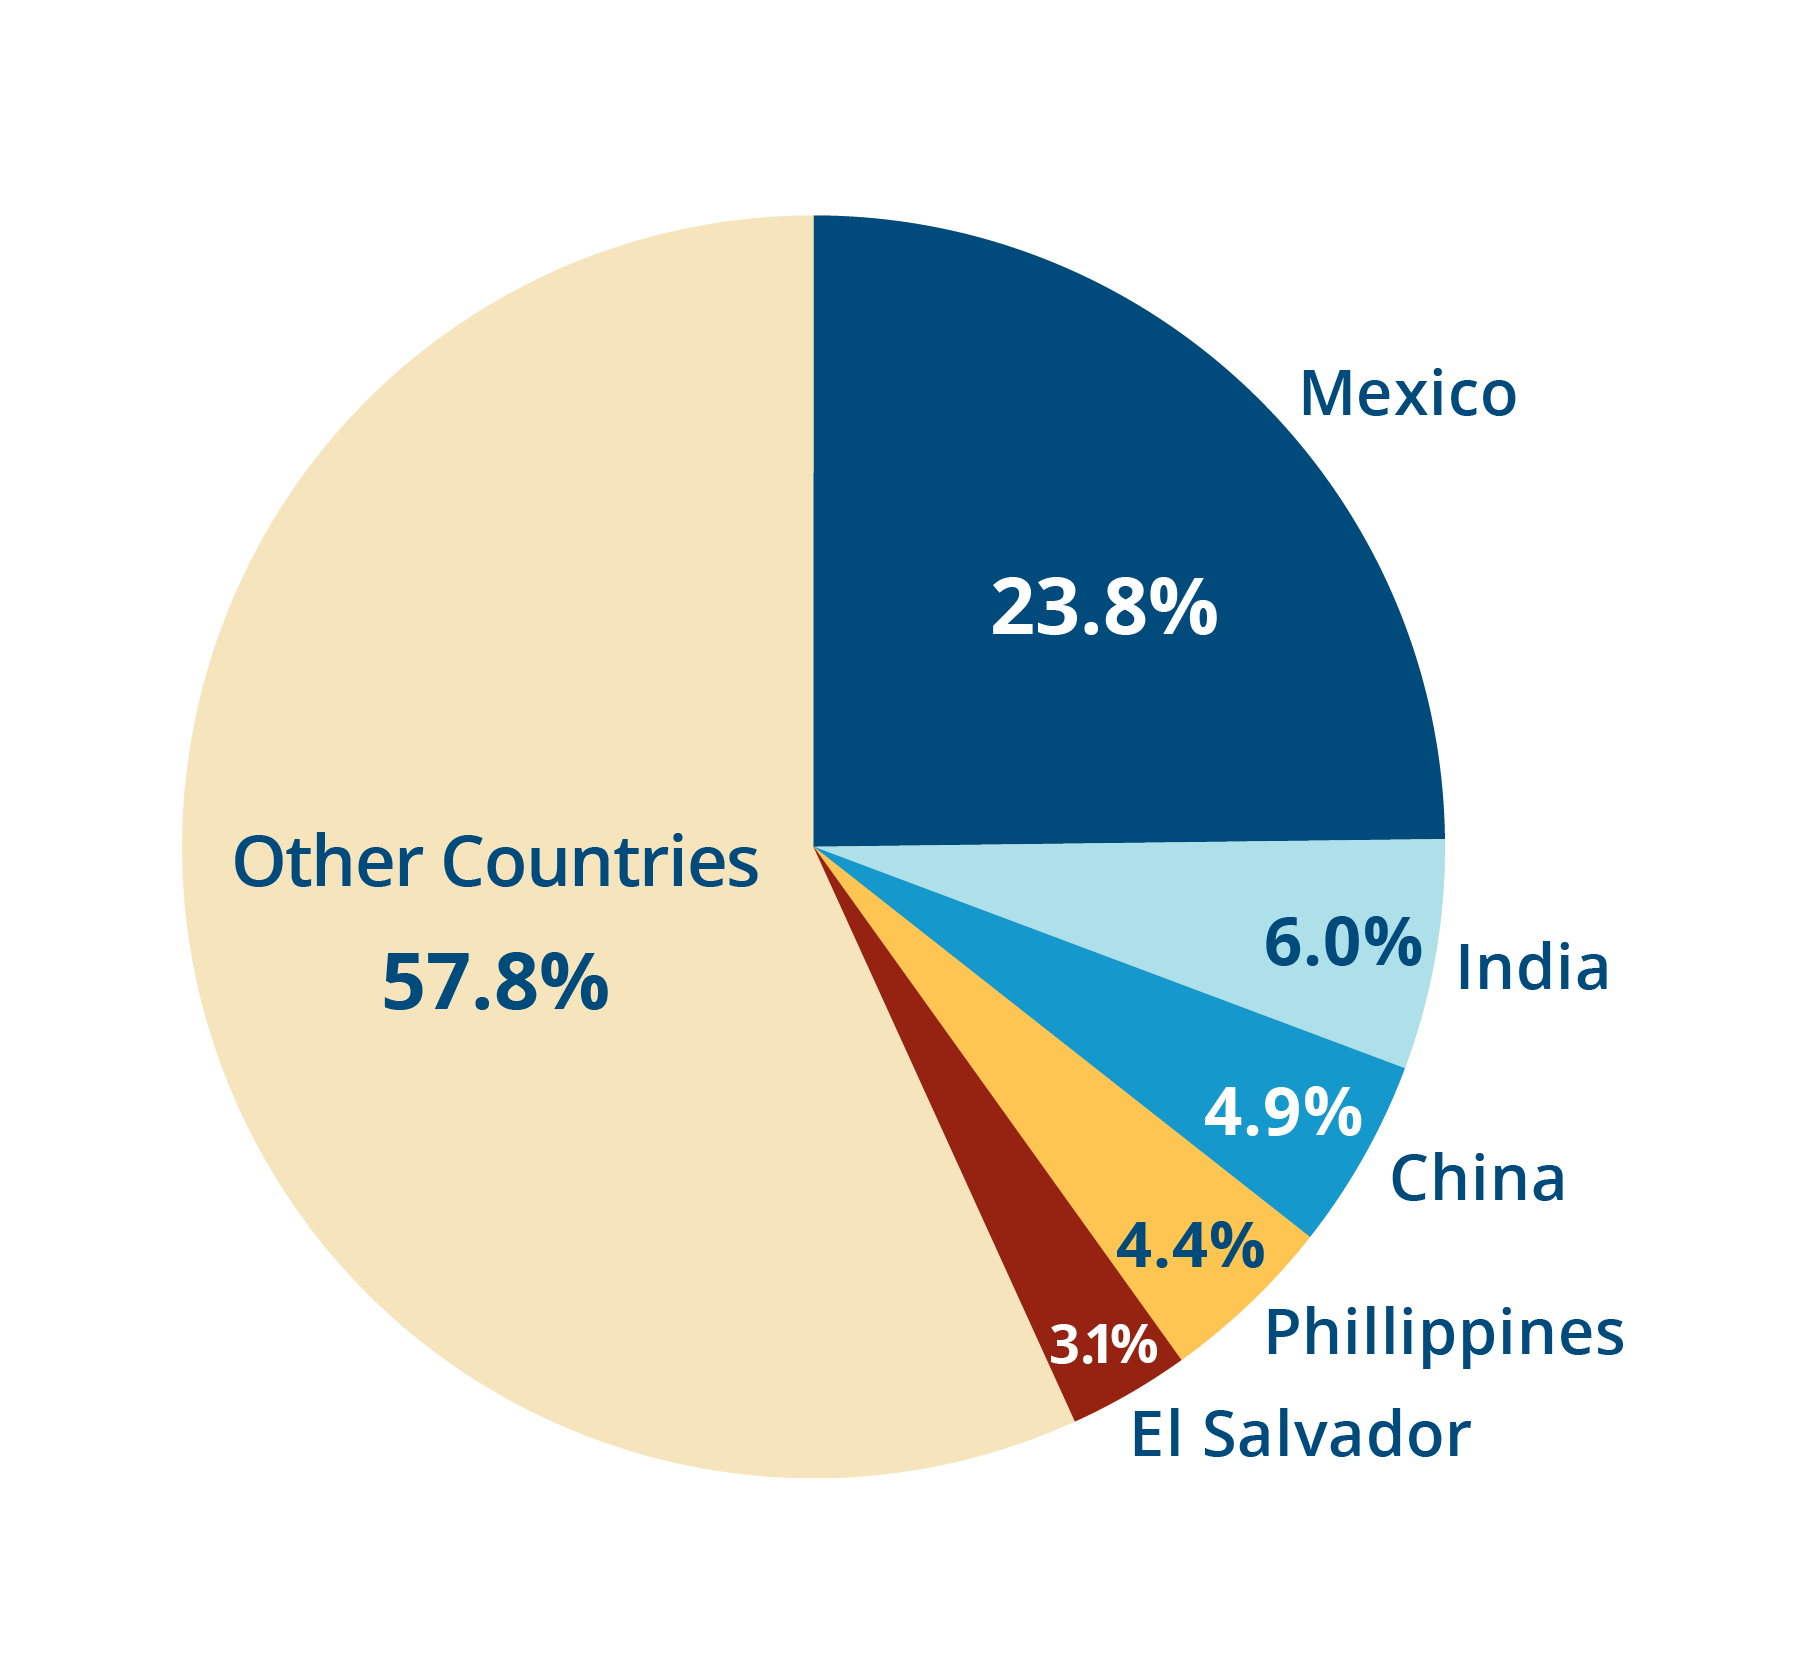
Source: U.S. Census 2022 American Community Survey 5-year Estimates
What is the migration status of immigrants in the United States?
The majority of U.S. immigrants (77.7%) have authorization.
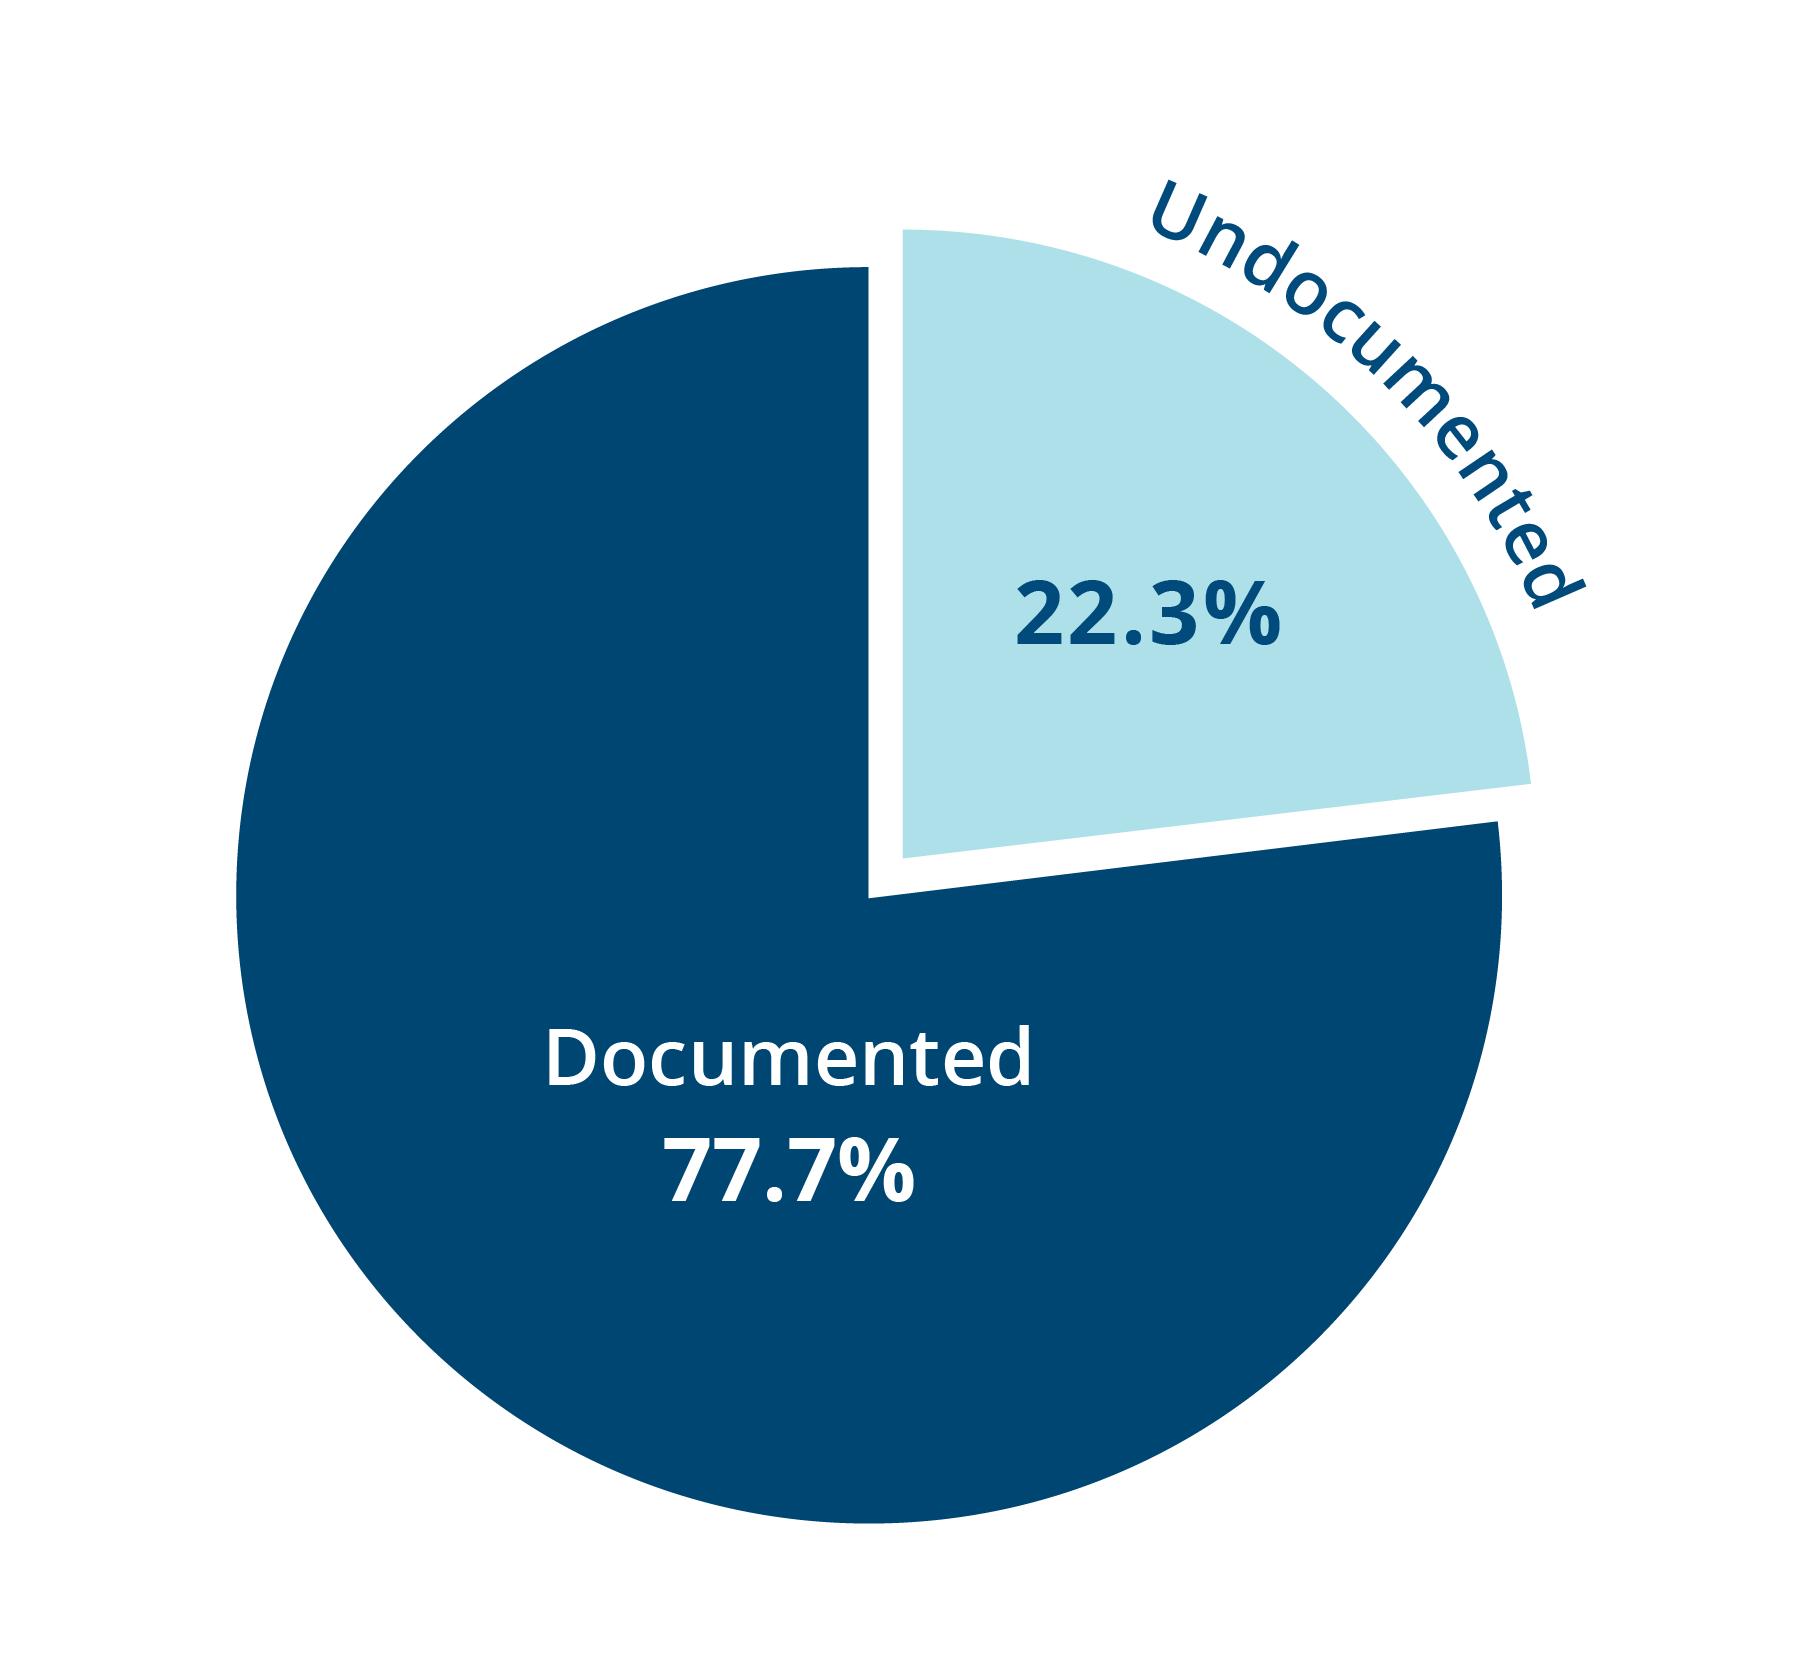
Source: Pew Research Center estimates based on augmented 2021
U.S. Census Bureau data
More than half (52.2%) of all immigrants have become United States citizens.
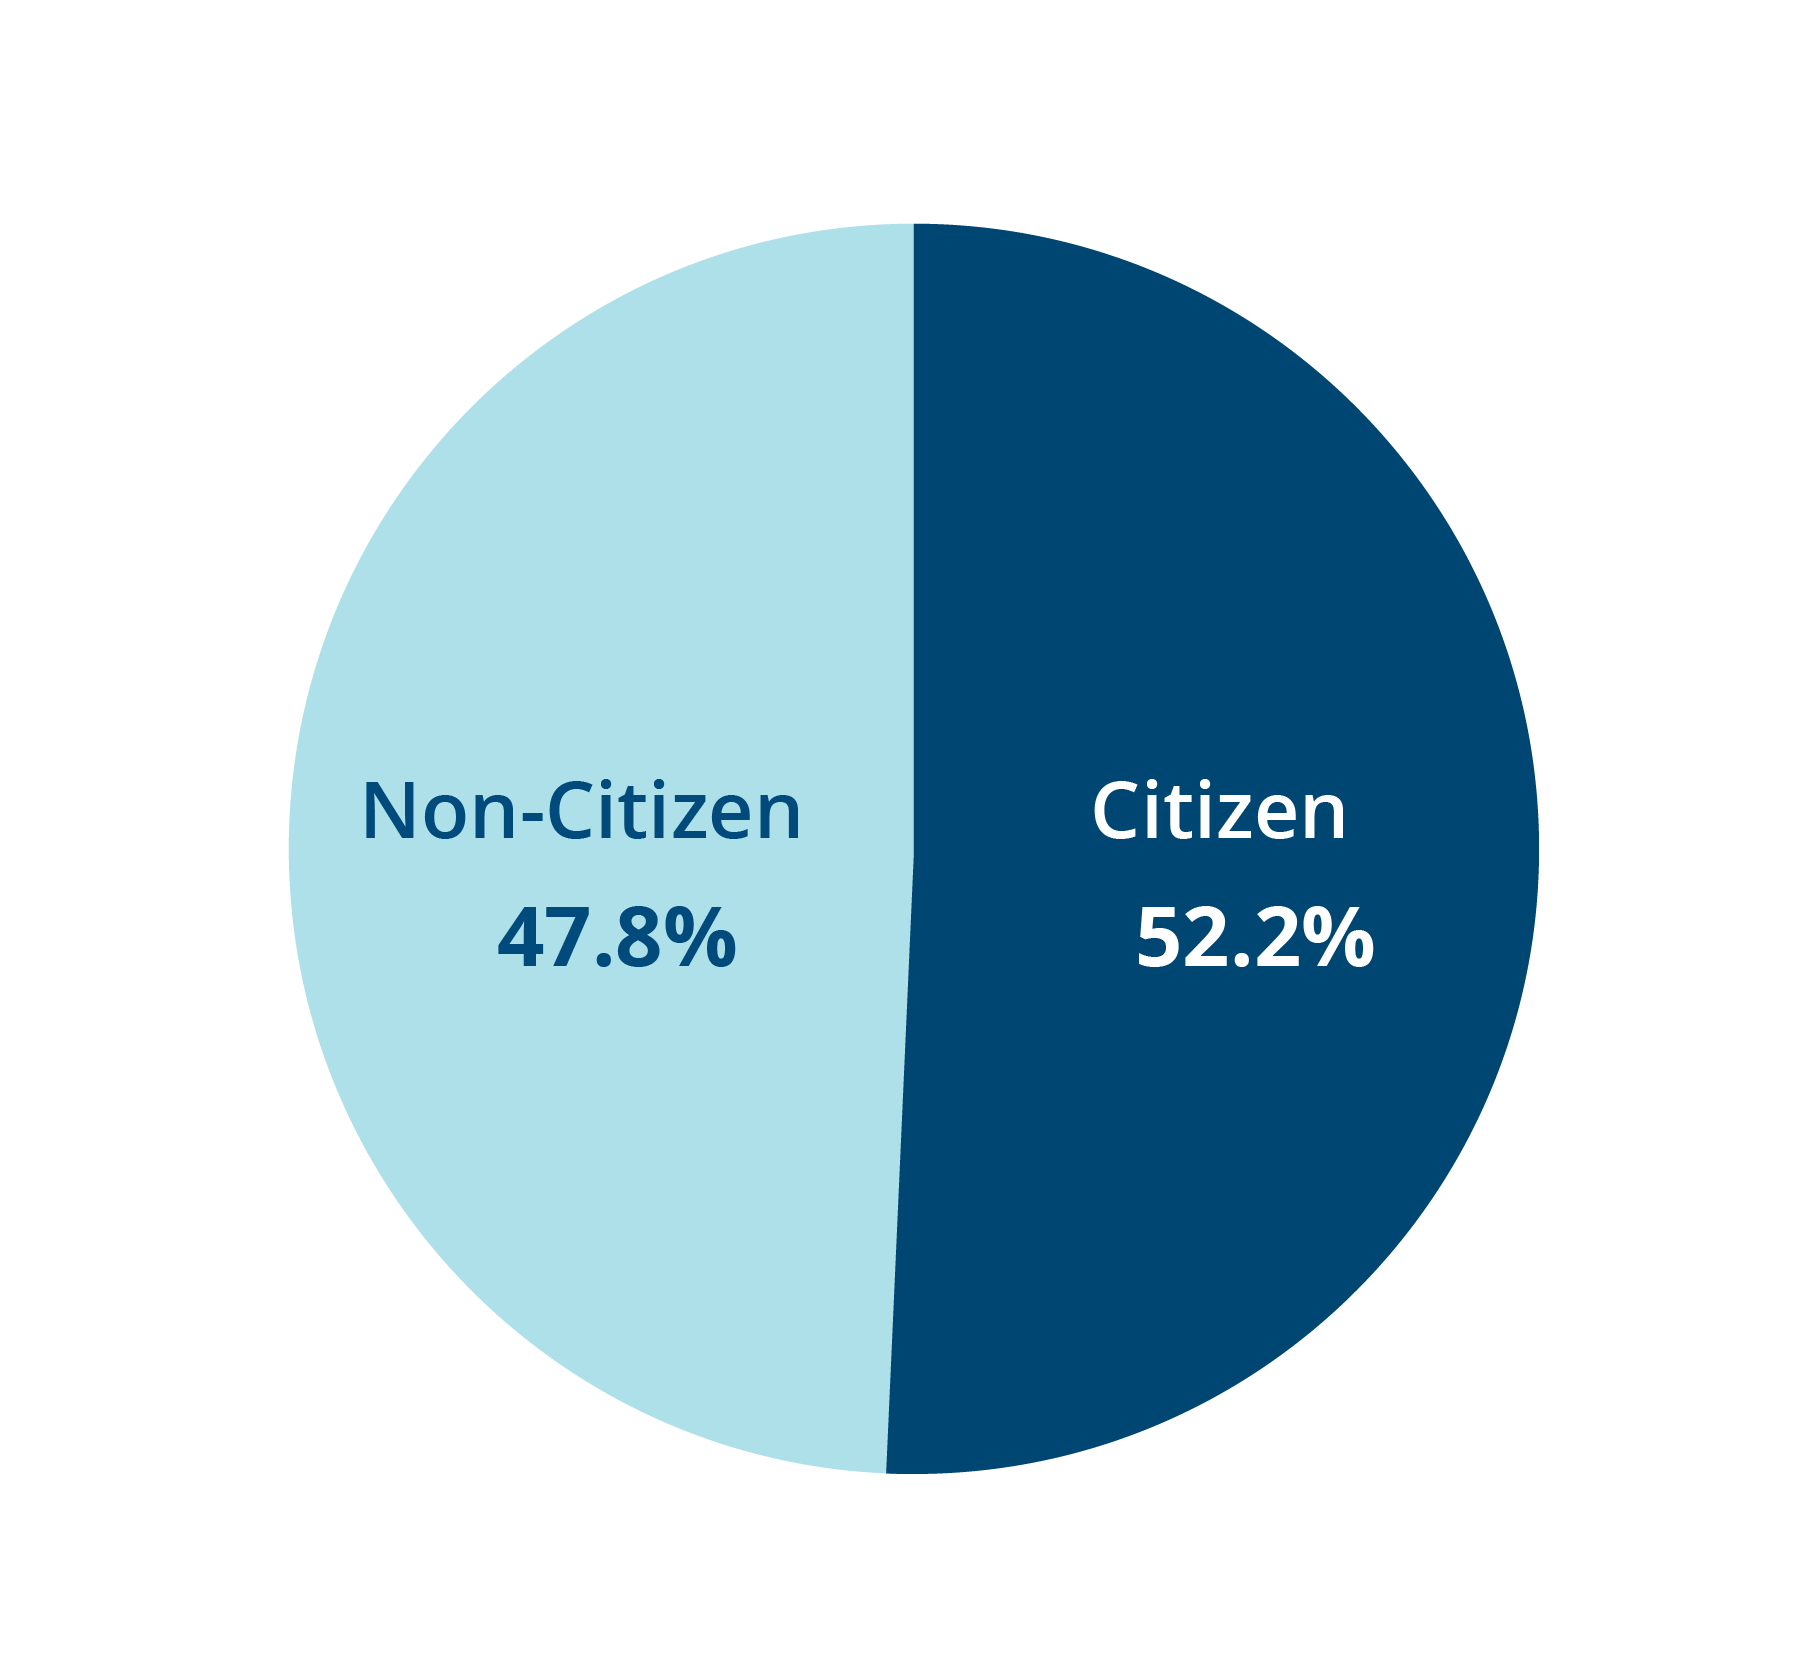
Source: U.S. Census 2022 American Community Survey 5-year Estimates
How do immigrants impact the United States workforce?
Immigrants have a higher workforce participation rate.*
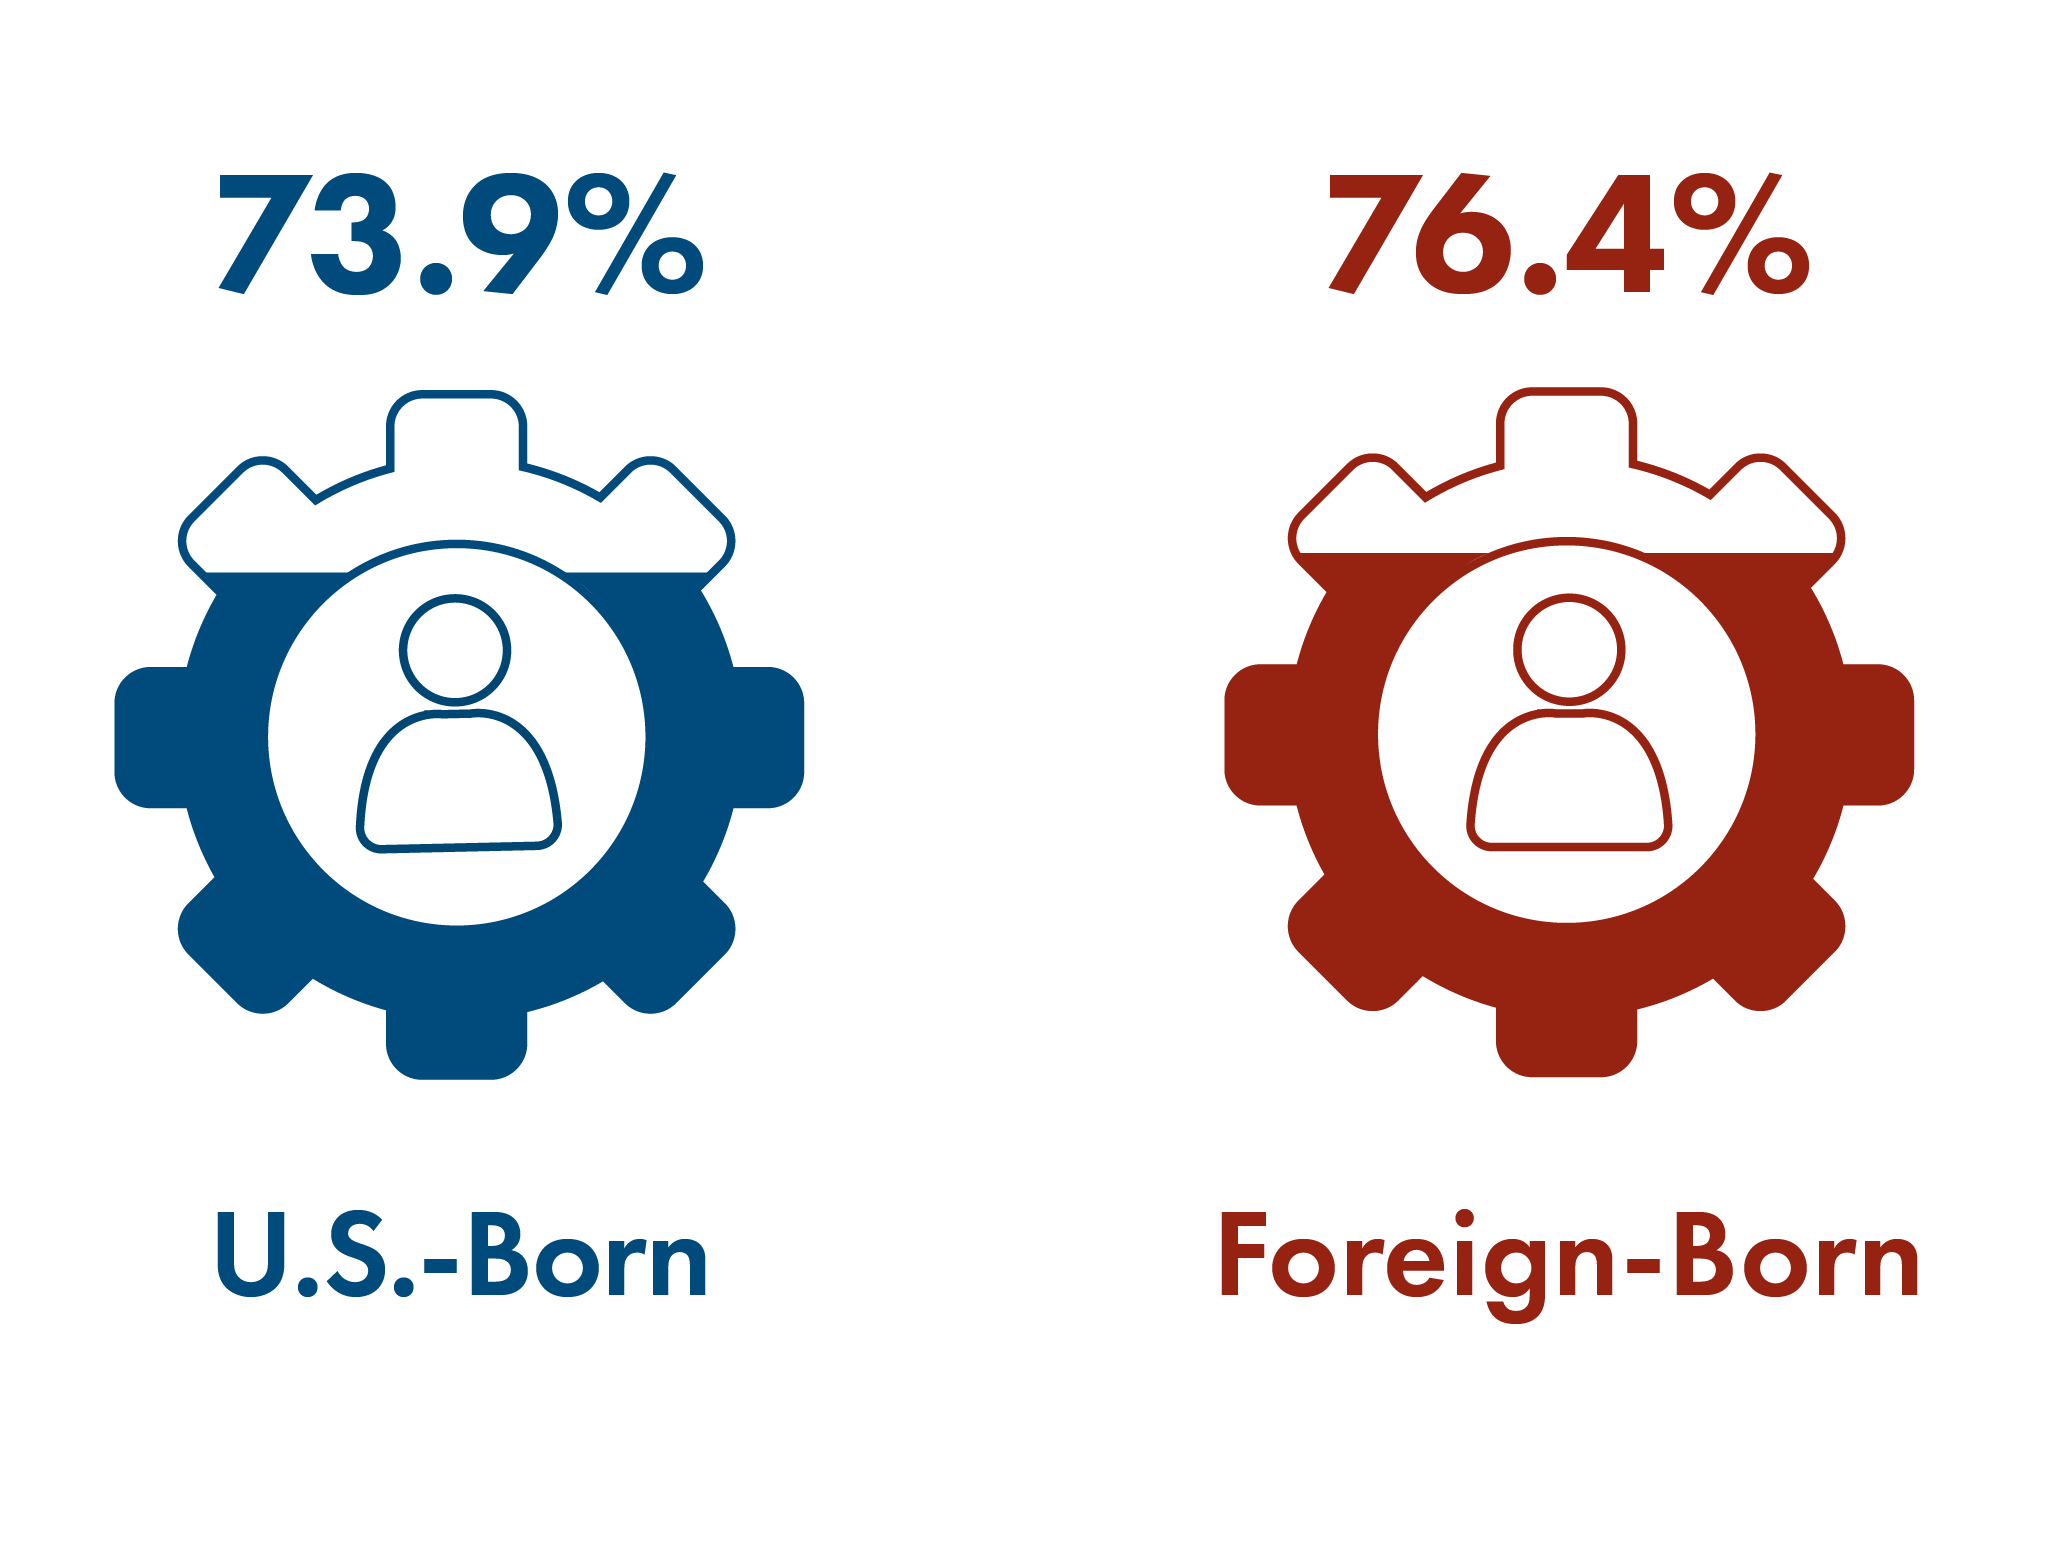
Source: U.S. Census 2022 American Community Survey 5-year Estimates
*The workforce participation rate is calculated by dividing the number of people working and those actively seeking work by the number of non-institutionalized, working-age (16-65) civilians.
Immigrants, particularly refugees, have higher self-employment rates.
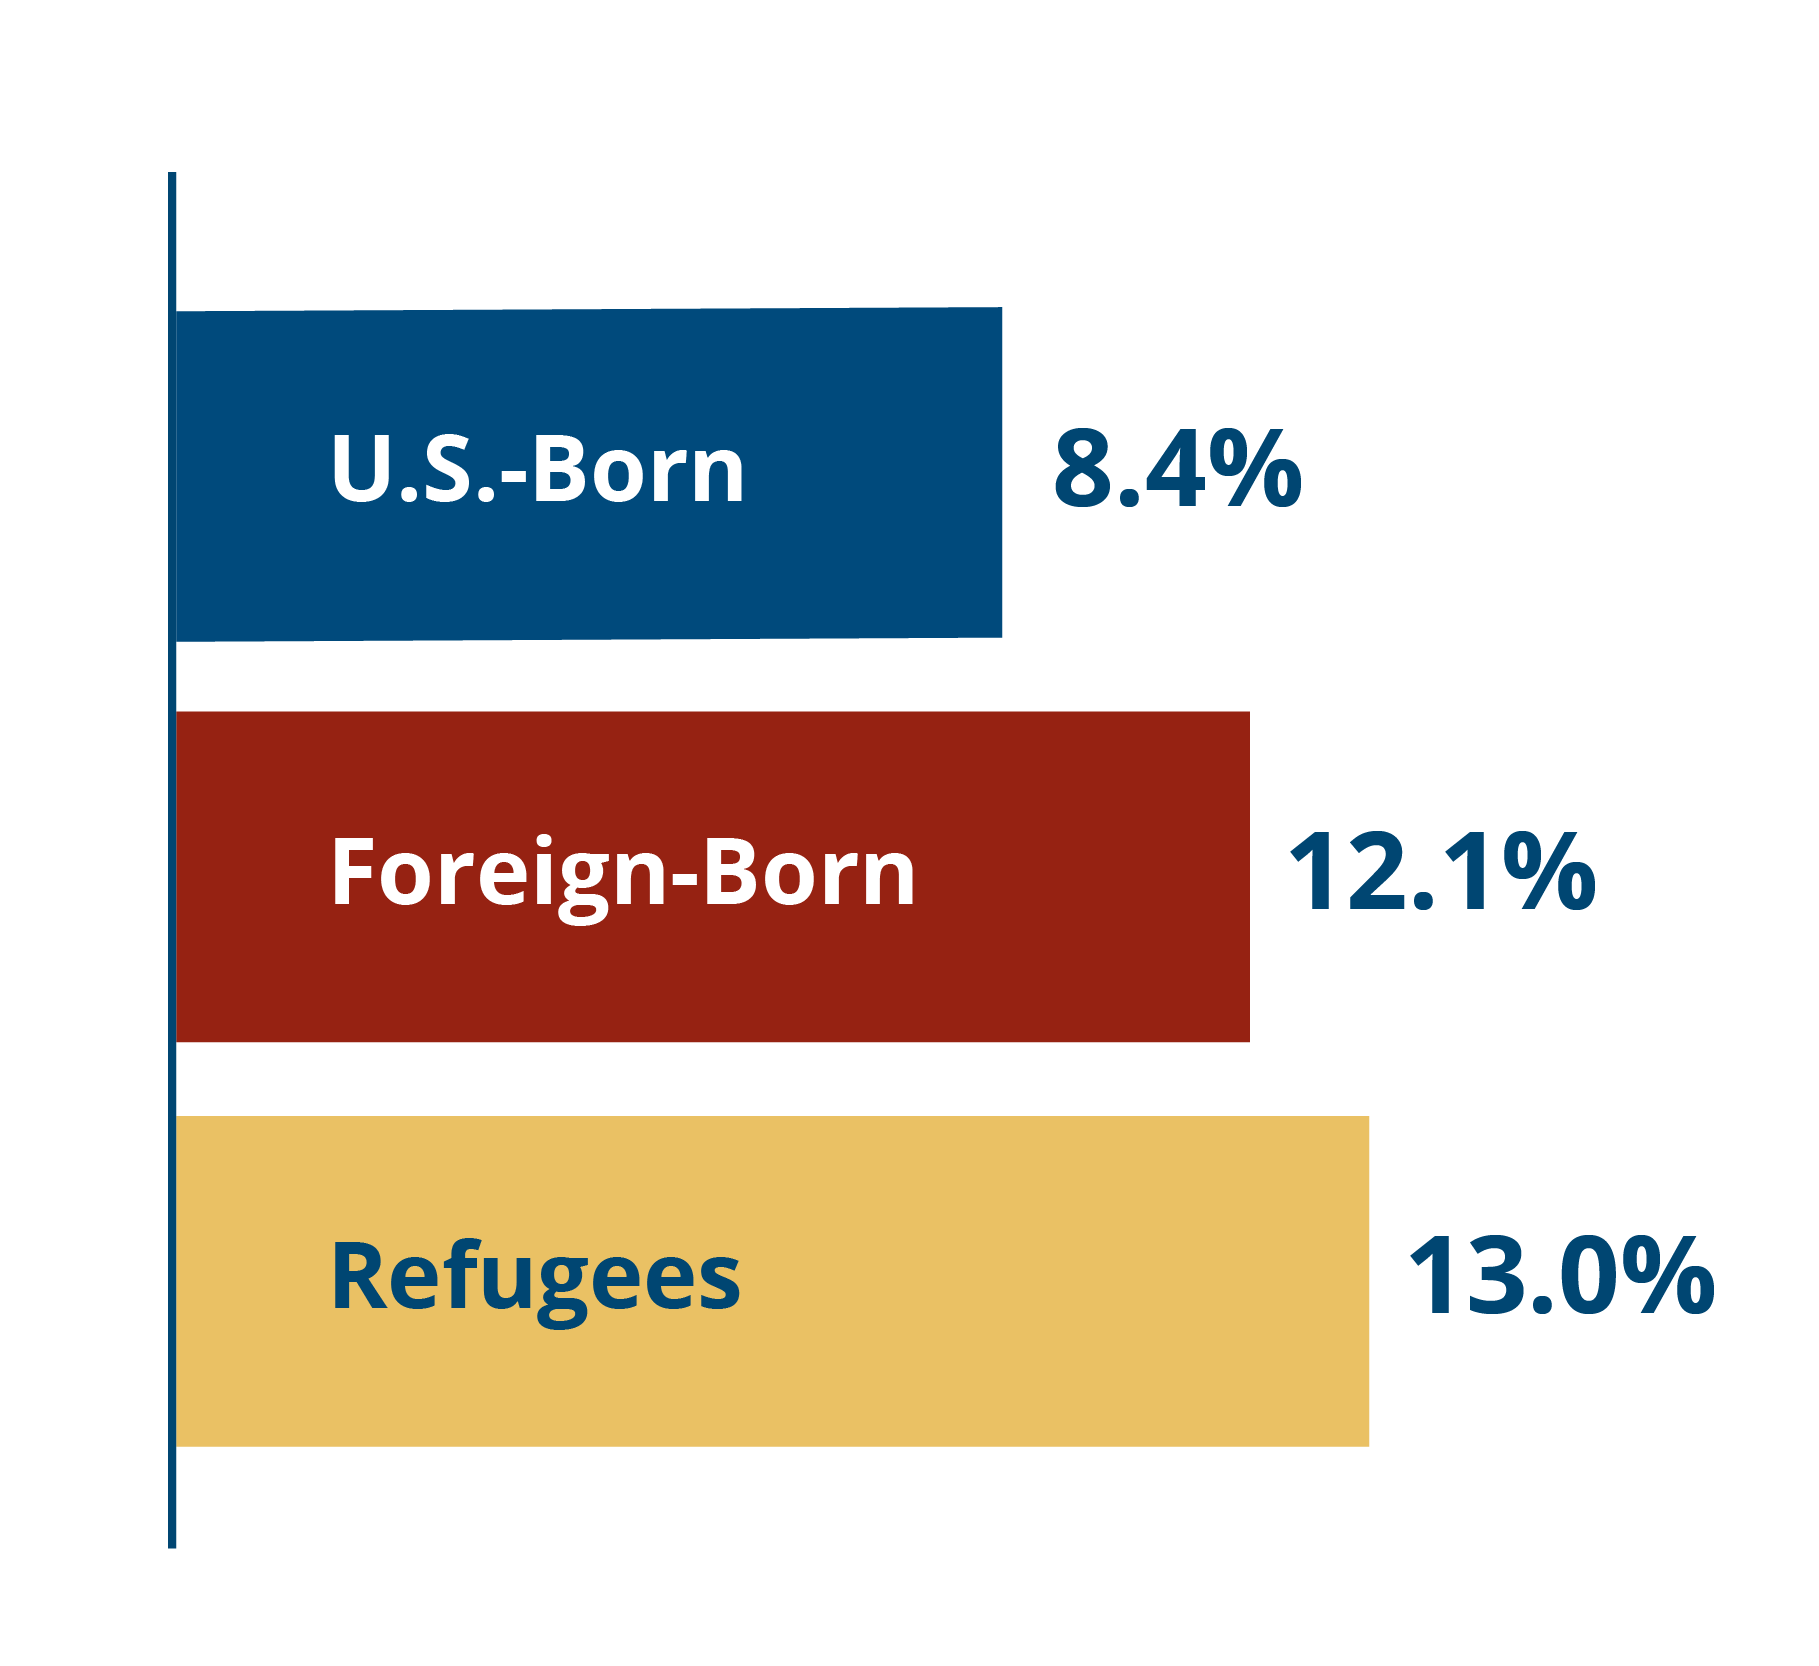
Source: U.S. Census 2022 American Community Survey 5-year Estimates and American Immigration Council, 2019
Nearly one third (31%) of new U.S. businesses are founded by immigrants.

Source: Indicators of Entrepreneurial Activity, UCLA, Jan. 2024